
Earlier in the year we blogged about Lessons learned from the DIAMAS survey-a-thons. In this blog we are pleased to share some initial results from the survey.
Crossing the finishing line
Before we discuss the early findings of the survey, a little background on how we reached the final numbers. We used a variety of processes to collect publicly available email addresses and other information for thousands of entities we believed could be among our survey’s target group. We split the data by country and used our contacts to refine the data. This process was dependent both on the quality of the data we started with, and the work spent refining the information. We gathered 5,325 emails for potential respondents. Regrettably, we only received 75 responses, a response rate below 1.5 percent.
However, we weren’t daunted and moved quickly to plan B! We sent emails via organisations, societies and listservs with a membership/user group relevant to the survey. This approach was far more successful and resulted in 582 responses.
A total of 657 responses were received when the survey closed. When looking at the raw data we noticed a high number of uncompleted responses. After contacting those who hadn’t properly submitted their questionnaires but were nearly (or actually) finished to ask permission to include their information, we were able to include a further 47, resulting in a total of 704 responses.
Lessons learned
A key lesson learned is to use the second approach in future projects, and not waste valuable time collecting public email addresses. However, the second approach did mean that many respondents will have received more than one email about the survey. Another lesson learned for those looking to send out surveys is to ensure that the final submit button is clearly visible for respondents.
Cleaning the data
We’ve spent the last few weeks cleaning the data. The biggest task was to ensure that the free text responses submitted were translated and checked for accuracy before being added back into the raw dataset.
Unfortunately, a number of responses had to be discarded for various reasons. A few were “dummies” created in the project, some were clearly duplicates, others were deemed to be duplicates after close scrutiny. A handful were also out of our geographical scope.
We had to make a decision about when to stop the cleaning process. We expect to find further responses that might be deemed out of scope or where the data is insufficient, but we will now report on this as part of the analysis process and report writing.
The first results
At the end of the data cleaning we had 685 valid responses for analysis. This included responses from 43 countries across the European Research Area (ERA)(see Figure 1).
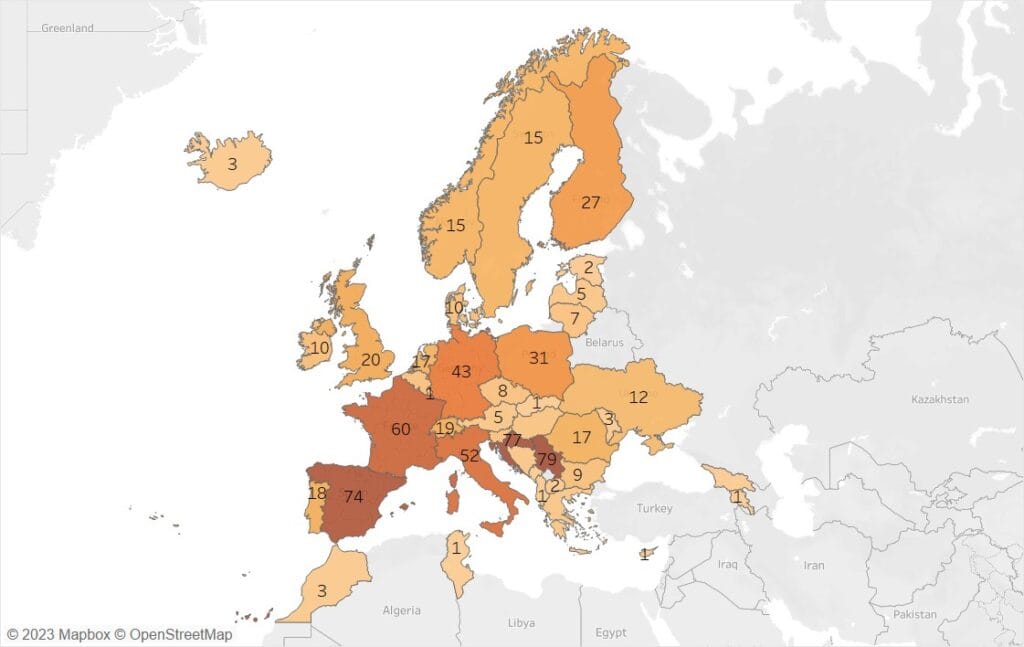
Responses were dominated by Serbia, Croatia and Spain. However, eight countries in the ERA only submitted one response. We were particularly pleased to receive 12 responses from Ukraine. Later in the project, look out for the country case studies as part of the landscape report. We plan to cover each country, although some with lower responses will only be brief overviews to protect anonymity. It should be noted that because of the size of the ERA, responses from certain countries in Northern Africa (Morocco and Tunisia) and Southwest Asia (Georgia and Armenia) were considered valid responses. The United Kingdom was also included in the valid responses.
Türkiye is included in our geographical scope but due to the earthquake we decided to postpone the Turkish survey until this autumn. We will then publish a separate country study for Türkiye.
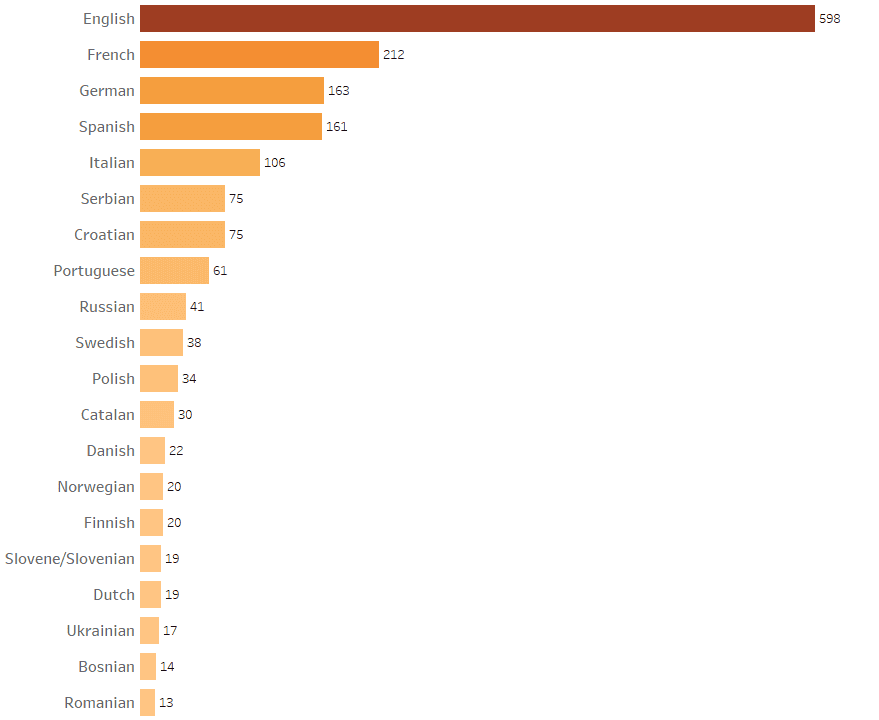
Institutional Publishing Service Providers (IPSPs) reported a total of 37 languages used in their publications. IPSPs could select multiple languages and Figure 2 shows the top 20. English was the dominant language, with French, German and Spanish well represented.
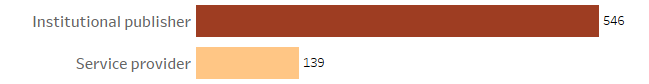
In our scoping documents we divide IPSPs into two groups, institutional publishers and service providers to institutional publishers (see “What are IPSPs & why are they important for DIAMAS?” for an explanation of the concept). We asked IPSPs to self identify in the survey and Figure 3 shows the split. In this data we included two SPs from outside of the ERA as they provide services to European IPs. One early observation from IPSPs that we were already familiar with was that self identification did not always give us the results we were expecting and this is something that we will take up later in the project.
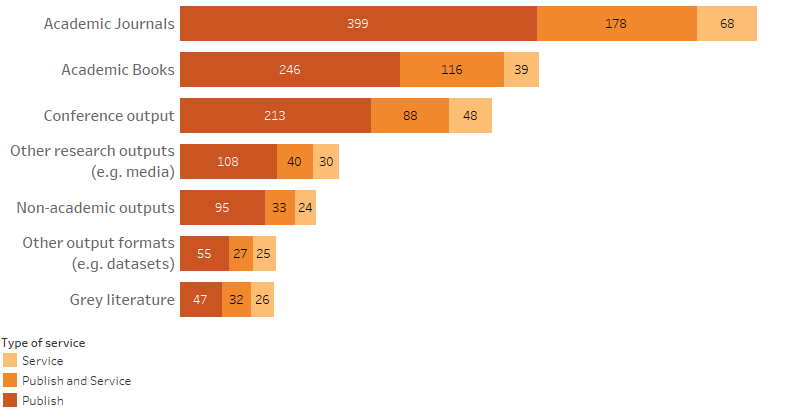
We asked the IPSPs about the publishing services they provided. Figure 4 shows that, as expected, most IPSPs either published, or provided services to journals – or both. However, book publishing, and to a lesser extent conference output, was also prevalent.
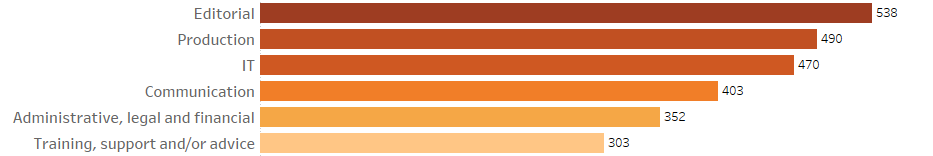
We also asked IPSPs about the services they provide. In the full analysis we will go into more detail, but for now, Figure 5 shows the services on offer from the respondents.
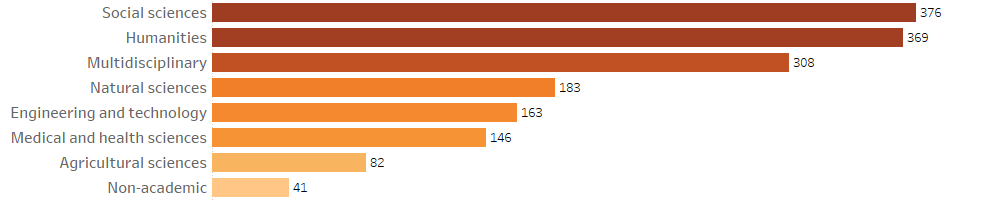
Finally, a word about disciplinary coverage. All of the broad disciplines we used were represented but the social sciences and humanities dominated, closely followed by multidisciplinary IPSPs (see Figure 6)
Next steps
While many colleagues are preparing to enjoy the summer holidays, the DIAMAS team will be working hard to fully analyse the survey data – there are many more questions to look into!
A subset of the data used here will make its way into the IPSP Database. This publicly available database will be published shortly after the summer.
We are in the early days of analysing the data, but we are starting to notice possible trends and details which will enrich our understanding of the IPSP landscape.